To graph the slope-intercept form of a linear equation, you need just two points on the line. This guide will help you understand how to find these points and use them to draw a perfect graph, step by step. Let’s dive in and learn how to graph the slope-intercept form of a linear equation in the simplest way possible!
What Is Slope-Intercept Form?
The slope-intercept form of a linear equation is expressed as:
y = mx + b
- m is the slope, showing the steepness of the line.
- b is the y-intercept, the point where the line crosses the y-axis.
By using this form, we can graph any linear equation efficiently.
Steps to Graph the Slope-Intercept Form of a Linear Equation
To graph a linear equation, we need two points on the line. Let’s find these points step by step:
Step 1: Start with the Y-Intercept
The y-intercept (b) is the easiest starting point. It’s the point where the line crosses the y-axis, and the x-coordinate at this point is always 0.
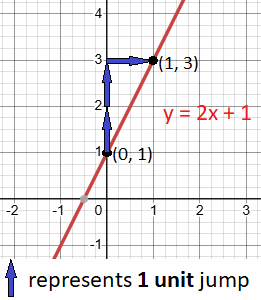
- For example, in the equation y = 2x + 1, the y-intercept is 1. This gives the point (0, 1).
- Plot the point (0, 1) on the graph.
Step 2: Find the Second Point
Use the slope (m) to locate another point on the line.
The slope (m) represents the ratio of the vertical change (rise) to the horizontal change (run) between two points on a line. It is expressed as:
m = ![]()
- If m is positive:
From the y-intercept, move up by the numerator and then right by the denominator. - If m is negative:
From the y-intercept, move down by the numerator and then right by the denominator.
Example:
- In the equation y = 2x + 1, the slope (m) is 2 which is positive and can be written as the fraction

- From (0, 1), move up 2 units and then right 1 unit to mark the point (1, 3) on the graph.
Step 3: Draw the Line
Use a ruler to connect the two points with a straight line. Extend the line across the graph.

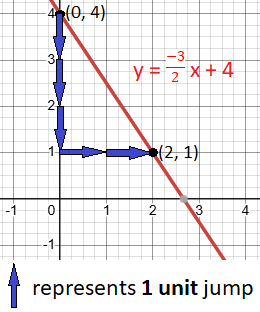
Example 1: Graph y =  x + 4
x + 4
- Y-Intercept: The y-intercept is 4. Plot the point (0, 4) on the graph.
- Slope: The slope is
 :
:- Since slope is negative, from point (0, 4), move down 3 units and then right 2 units to mark the point (2, 1) on the graph.
- Graph: Connect (0, 4) and (2, 1) with a straight line.

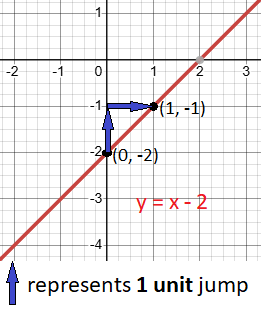
Example 2: Graph y = x − 2
- Y-Intercept: The y-intercept is – 2. Mark the point (0, − 2) on the graph.
- Slope: The slope is 1 which is positive and equivalent to the fraction
 :
:- Move up 1 unit and then right 1 unit to plot the point (1, −1) on the graph.
- Graph: Connect (0, −2) and (1, −1) with a straight line.

Why Use the Slope-Intercept Form?
The slope-intercept form makes graphing easy by giving us a clear starting point (b) and a pattern to follow (m). It’s especially useful for quickly sketching linear equations.
Final Thoughts
Graphing the slope-intercept form of a linear equation is a key skill in algebra. By using the y-intercept and slope, you can accurately draw the graph of any linear equation. Practice these steps, and soon, graphing linear equations will feel like second nature!
This guide has shown you how to graph the slope-intercept of a linear equation effectively. Keep practicing with different equations, and you’ll master this concept in no time.
Related Posts:
- Introduction. Linear Equation of a line parallel to y-axis
- Linear Equation and graph of a line parallel to x-axis
- What is the Slope of a Line
- How to Calculate the Slope of a Line
- Solved example of finding slope of a line that passes through two given points
- How to Identify Parallel and Perpendicular Lines Using Slopes
- How to derive Linear Equation using Point-Slope Form
- How to easily find X-Intercept and Y-Intercept of a Linear Equation
- Slope-Intercept Form of a Linear equation. A Simple Guide