In this guide, we will continue our discussion on the slope of a line and focus on how to calculate slope of a line and interpret it from a graph. In our previous post, We discussed the concept of slope, its formula, and the key points to remember. Now, we’ll take a closer look at the types of slopes and how to recognize them on a graph. By the end of this guide, you’ll understand what a positive, negative, zero, or undefined slope looks like, and what each type of slope tells us about a line.
Recap: What is the Slope of a Line?
The slope of a line tells us how steep the line is and in which direction it’s going. It’s a measure of the rise (how much the line goes up or down) over the run (how far the line goes horizontally).
Formula for Slope
Here’s the formula to calculate the slope of a line, from its two points:
Let ![]() and
and ![]() are two distinct points on a non-vertical line. The slope m is given by:
are two distinct points on a non-vertical line. The slope m is given by:
Slope = m = ![]()
Where:
 represents the vertical change (also called the “rise”). This tells us how much the line goes up or down.
 represents the horizontal change (also called the “run”). This tells us how much the line goes left or right.
- Thus, we can say:
- Slope = m =

- Slope = m =
Now, let’s explore the types of slopes and learn how to recognize them on a graph.
Types of Slope
There are four types of slope:
- Positive Slope: The line goes up as you move to the right.
- Negative Slope: The line goes down as you move to the right.
- Zero Slope: The line is flat (horizontal).
- Undefined Slope: The line is vertical (up and down).
Let’s dive deeper into each type with examples.
Positive Slope
When a line has a positive slope, it means the line is going upward as you move from left to right on the graph. The larger the number, the steeper the line.
Example: Imagine climbing a hill. As you move to the right, you also go higher, which means the slope is positive.
Example of Positive Slope:
Let’s find the slope of a line passing through the points (1, 2) and (2, 4).
- Write down the points:
- P(x1 , y1) = (1, 2) means x1 = 1 and y1 = 2
- Q(x2 , y2) = (2, 4) means x2 = 2 and y2 = 4
- Find the change in y (vertical movement): y2 – y1 = 4 – 2 = 4
- Find the change in x (horizontal movement): x2 – x1 = 3 − 1 = 2
- Calculate the slope:
- Slope = m =

- The slope is 2, meaning the line rises 2 units up for every 1 unit you move to the right.
- Slope = m =
Graph:
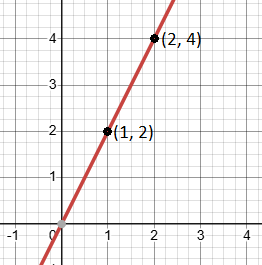
If we plot the points (1,2) and (2, 4), you’ll see a line slanting upward. This is a positive slope.
Conclusion: A positive slope means the line is rising as you move from left to right. This tells us that as one value (x) increases, the other value (y) also increases.
Negative Slope
A line with a negative slope goes downward as you move from left to right on the graph. The more negative the number, the steeper the line drops.
Example: Think about sliding down a hill. As you move to the right, you’re also going down, which means the slope is negative.
Example of Negative Slope:
Let’s calculate the slope of a line passing through (1, 3) and (3, 1).
- Write down the points:
- P(x1 , y1) = (1, 3) means x1 = 1 and y1 = 3
- Q(x2 , y2) = (3, 1) means x2 = 3 and y2 = 1
- Find the change in y (vertical movement): y2 – y1 = 1 – 3 = -2
- Find the change in x (horizontal movement): x2 – x1 = 3 − 1 = 2
- Calculate the slope:
- Slope = m =

- The slope is -1, meaning the line goes down 1 unit for every 1 unit you move to the right.
- Slope = m =
Graph:
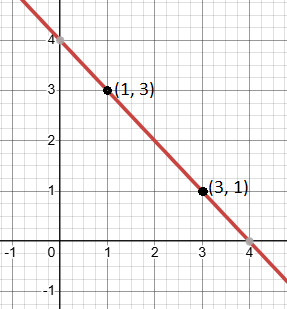
Plotting the points (1, 3) and (3, 1) on a graph will show a line sloping downward, indicating a negative slope.
Conclusion: A negative slope means the line is falling as you move to the right. This tells us that as one value (x) increases, the other value (y) decreases.
Zero Slope
A line with a zero slope is perfectly horizontal. It doesn’t go up or down at all; it stays level.
Example: Think of a flat road with no incline. As you walk along it, you neither go up nor down.
Example of Zero Slope:
Let’s find the slope of a line passing through (-3, 3) and (-1, 3).
- Write down the points:
- P(x1 , y1) = (-3, 3) means x1 = -3 and y1 = 3
- Q(x2 , y2) = (-1, 3) means x2 = -1 and y2 = 3
- Find the change in y (vertical movement): y2 – y1 = 3 – 3 = 0
- Find the change in x (horizontal movement): x2 – x1 = -1 − (- 3) = -1 +3 = 2
- Calculate the slope:
- Slope = m =

- The slope is 0, which means the line doesn’t go up or down at all.
- Slope = m =
Graph:
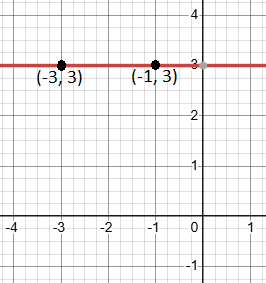
Plot the points (-3, 3) and (-1, 3) on a graph. Draw a straight horizontal line through them. This line has a zero slope.
Conclusion: A zero slope means the line is perfectly flat and doesn’t rise or fall. This tells us that the y-value remains constant as the x-value increases.
Undefined Slope
A line with an undefined slope is a vertical line. Since the line doesn’t move left or right (the change in x is zero), we say the slope is undefined.
Example: Imagine climbing a ladder straight up. You’re going straight up or down without moving sideways.
Example of Undefined Slope:
Find the slope of the line passing through (3, 1) and (3, 3).
- Write down the points:
- P(x1 , y1) = (3, 1) means x1 = 3 and y1 = 1
- Q(x2 , y2) = (3, 3) means x2 = 3 and y2 = 3
- Find the change in y (vertical movement): y2 – y1 = 3 – 1 = 2
- Find the change in x (horizontal movement): x2 – x1 = 3 – 3 = 0
- Calculate the slope:
- Slope = m =

- Since we can’t divide by zero, the slope is undefined.
- Slope = m =
Graph:
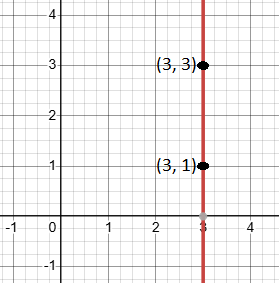
Plot the points (3, 1) and (3, 3), then draw a straight vertical line through them. This line has an undefined slope.
Conclusion: An undefined slope means the line is vertical. This tells us that as the y-value changes, the x-value stays the same, meaning the line does not move left or right
How to Determine the Slope of a line from its Graph
You can find the slope of a line just by looking at its graph. Here’s how:
Positive Slope:
If the line goes up from left to right, it has a positive slope.
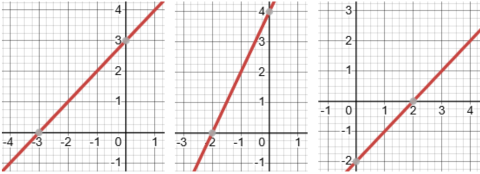
Each of the three line-graphs shown above has a positive slope.
Negative Slope:
If the line goes down from left to right, it has a negative slope.
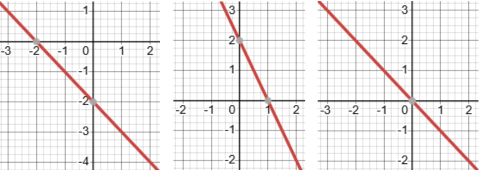
Each of the three line-graphs shown above has a negative slope.
Zero Slope:
If the line is horizontal, it has a zero slope.
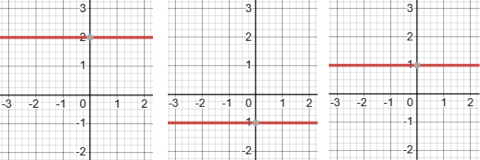
Each of the three line-graphs shown above has zero slope.
Undefined Slope:
If the line is vertical, it has an undefined slope.
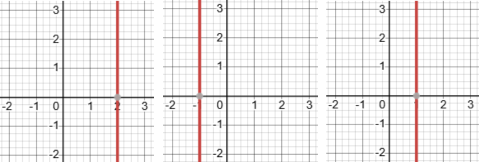
Each of the three line-graphs shown above has undefined slope.
Conclusion
Understanding the slope of a line is essential for interpreting graphs. A positive slope means the line rises, a negative slope means it falls, a zero slope means it is flat, and an undefined slope means it is vertical. By practicing these examples, you’ll become confident in recognizing slopes and how to calculate the slope of a line.
Related Posts:
- Introduction. Linear Equation of a line parallel to y-axis
- Linear Equation and graph of a line parallel to x-axis
- What is the Slope of a Line
- How to identify and calculate the undefined slope of a line with easy step-by-step solved example.
- How to Identify Parallel and Perpendicular Lines Using Slopes
- How to derive Linear Equation using Point-Slope Form
- How to easily find X-Intercept and Y-Intercept of a Linear Equation
- Slope-Intercept Form of a Linear equation. A Simple Guide