Linear inequalities might sound complicated, but they’re actually quite similar to linear equations! When we work with linear inequalities, we’re trying to find a whole area on a graph, rather than just a single line. In this guide, you’ll learn the basics of linear inequalities and how to graph them step-by-step. Let’s dive into the fun world of inequalities and graphing!
What is a Linear Inequality? Understanding Inequality Symbols
A linear inequality is like a linear equation but instead of an equal sign (=), it has inequality symbols like:
- Greater than (>)
- Less than (<)
- Greater than or equal to (≥)
- Less than or equal to (≤)
For example:
- y > 2x – 1
- y ≤ −x + 1
When we graph a linear inequality, we’re actually graphing a region of the coordinate plane, not just a single line. The area represents all possible solutions to the inequality.
The graph of a linear inequality represents a region or area on the coordinate plane, not just a line.
Step-by-Step Guide: How to Graph Linear Inequalities
When graphing linear inequalities, we follow similar steps to graphing linear equations, but add a step to show which region (above or below the line) represents the solution.
Lets understand each step through an example.
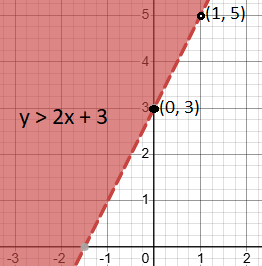
Example 1: Graph y > 2x + 3
Step 1: Plotting the Boundary Line for the Inequality
To graph the inequality, first, graph the corresponding linear equation. Replace the inequality symbol with an equal sign. That is, for inequality y > 2x + 3, graph the equation y = 2x + 3.
y = 2x + 3 is slope-intercept form of a linear equation with slope 2 and y-intercept 3.
For making the graph of y = 2x + 3,
- Start by plotting the y-intercept (0, 3) on the y-axis.
- Use the slope (m = 2) to find another point:
- Since slope is positive, from point (0, 3), move 2 units up and then 1 unit right. This gives the point (5, 1).
- Connect the points (0, 3) and (5, 1) with a straight line.
For a detailed explanation of how to graph the slope-intercept form, including tips and examples, check out How to Graph Slope-Intercept Form.
Step 2: Choose a Dashed or Solid Line Based on Inequality Type
Now, you need to decide whether the line should be solid or dashed:
- Solid line for ≤ or ≥.
- Dashed line for < or >.
In our example, since we have y > 2x + 1, the line should be dashed, because it’s “greater than (>)”
Step 3: Shading the Solution Region for the Linear Inequality
Once the line is drawn, you need to shade the area that represents the solutions to the inequality.
Substitute (0, 0) in the inequality. If the inequality is true, then that area is the correct solution region. If it’s false, shade the opposite side.
Put x = 0 and y = 0 in y > 2x + 3
0 > 2(0) + 3
0 > 3 (false)
So shade the opposite side of (0,0). That is, above the dashed line.
Graph:

The red shaded region represents the solution area for y > 2x + 3
Example 2: Graph y < x + 1
- Rewrite as y = x + 1.Plot the line y = x + 1
- The line should be a dashed line because it’s a “less than (<)” inequality.
- Test the point (0,0):
- y < x + 1
- 0 < 0 + 1
- 0 < 1 is true.
So shade the side with (0,0). That is, below the dashed line.
Graph:

The red shaded region is the solution for y < x + 1
Example 3: Graph y ≤ −2x + 4
- Rewrite as y = −2x + 4. Plot the line y = −2x + 4
- The line should be a solid line since it’s “less than or equal to (≤).”
- Test the point (0,0):
- y ≤ −2x + 4
- 0 ≤ −2(0) + 4
- 0 ≤ 4 is true.
so shade the side with (0,0).
Graph:

The red shaded region is the solution area for y ≤ −2x + 4
Example 4: Graph y ≥ – x – 2
- Rewrite as y = − x – 2. Plot the line y = − x – 2
- The line should be a solid line since it’s “greater than or equal to (≥).”
- Test the point (0,0):
- y ≥ − x – 2
- 0 ≥ − 0 – 2
- 0 ≥ – 2 is true.
so shade the side with (0,0).
Graph:

The red shaded region is the solution area for y ≥ – x – 2
Example 5: Graphing Vertical Linear Inequalities x ≤ 3
This is a vertical inequality where we’re concerned only with values of x.
- Rewrite as x = 3, which is a vertical line passing through x = 3 on the x-axis.
- The line should be a solid line since it’s “less than or equal to (≤).”
- Test the point (0,0):
- x ≤ 3
- 0 ≥ 3 4 is true, so shade the side with (0,0).
So shade the side with (0,0). That is, left side of the solid line.
Graph:

The red shaded area to the left of x ≤ 3 represents the solution
Quick Summary of Graphing Linear Inequalities
To graph linear inequalities:
- Plot the boundary line using the equal sign.
- Use a solid or dashed line based on the inequality symbol.
- Shade the solution area by testing a point.
By following these steps, how to graph linear inequalities becomes an easier task. With practice, you’ll be able to graph linear inequalities and understand which areas of the graph represent solutions!