Today, we’ll learn about linear equations and graphs, with a specific focus on lines parallel to the x-axis. We’ll explain this concept step-by-step with examples. By the end of this tutorial, you’ll know how to write, understand, and graph these linear equations.
Recap: What is a linear equation?
In the previous post, we discussed the linear equation in x and y, also named as general equation of a line.
a x + b y + c = 0 —————– equation (1)
where:
- x and y are variables.
- a, b, and c are numbers (called constants).
- The values of a and b cannot both be zero simultaneously, as this would result in the equation no longer being linear.
We also covered linear equation and graph of line parallel to the y-axis.
Let’s move onward.
Linear Equations and Graphs of Lines Parallel to the X-Axis
Consider the linear equation:
y = e
where e is a constant
The linear equation y = e represents a line parallel to the x-axis and intersects the y-axis at the point (0, e). This line stays at a constant height, regardless of the value of x. In other words, y remains the same, no matter how x changes.
Step-by-Step Examples
Example 1:
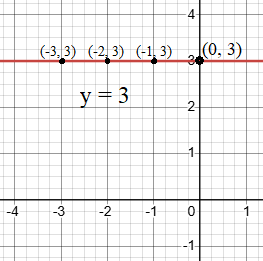
Graph the linear equation y = 3
Step 1: Understand the equation
- The equation y = 3 means that for every value of x, y remains 3. The line is horizontal and parallel to the x-axis, always at the height of y = 3.
Step 2: Plot the graph
- On the Cartesian plane, find the point (0, 3).
- Draw a horizontal line through this point, extending it to the left and right.

The red line represents the graph of the linear equation y = 3. It’s a horizontal line parallel to the x-axis. Four points are plotted on the line to demonstrate that for any value of x, y consistently remains 3.
Example 2:
Graph the Equation y = −2y
Step 1: Understand the equation
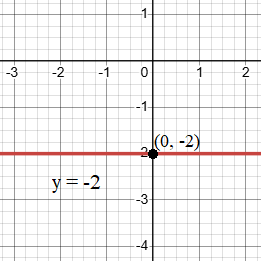
- In this case, y = −2 means the line stays at the height of -2 for all values of x.
Step 2: Plot the graph
- On the Cartesian plane, find the point (0, -2).
- Draw a horizontal line through this point, extending it left and right.

The red line represents the graph of linear equation y = -2, a line parallel to the x-axis, where y remains -2 for all values of x.
Example 3:
Graph the Equation y = 1
Step 1: Understand the equation
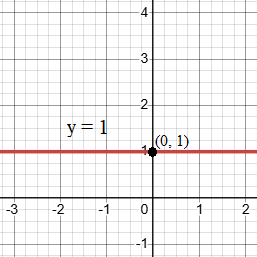
- The equation y = 1 tells us that y is always 1, no matter the value of x. This forms a horizontal line parallel to the x-axis.
Step 2: Plot the graph
- Locate the point (0,1) on the Cartesian plane.
- Draw a horizontal line through (0,1), extending it left and right.

The red line is a graph of equation y = 1. This horizontal line will remain at a constant height above x-axis.
Example 4:
Graph the Equation y = 0
Step 1: Understand the equation
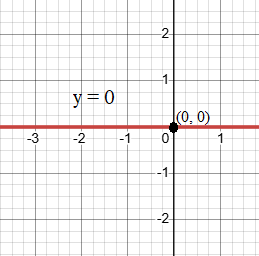
- The equation y = 0 simply represents the x-axis itself. For any value of x, y remains 0.
Step 2: Plot the graph
- Since y = 0 represents the x-axis, no additional plotting is required. The entire x-axis represents the graph of this equation

The graph of equation y = 0 is the x-axis itself.
Conclusion
In this tutorial, we explored linear equations representing lines parallel to the x-axis. These lines have the form y = e, where y remains constant regardless of the value of x. By following the step-by-step process for each example, you now have a solid understanding of how to write, understand, and graph these equations.
Understanding lines parallel to the x-axis will help you solve more complex problems involving linear equations and graphs. With this knowledge, you’re now ready to move on to even more advanced algebra concepts!
Related Posts:
- Introduction. Linear Equation of a line parallel to y-axis
- What is the Slope of a Line
- How to Calculate the Slope of a Line
- How to identify and calculate the undefined slope of a line with easy step-by-step solved example.
- How to Identify Parallel and Perpendicular Lines Using Slopes
- How to derive Linear Equation using Point-Slope Form
- How to easily find X-Intercept and Y-Intercept of a Linear Equation
- Slope-Intercept Form of a Linear equation. A Simple Guide